by Dave Alexander
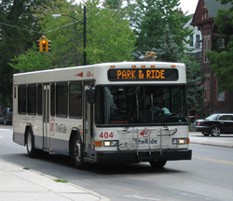
In 2014, local voters approved a new five-year transit tax, pumping an additional $21 million into the Ann Arbor Area Transportation Authority’s budget through 2019. The promise to voters was more buses, more places, more often. Voters were told that more buses running longer hours, making more frequent trips and reaching new destinations would mean more riders.
AAATA officials projected seven million passenger trips under the expanded service by Sept. 2015 but came up short. Ridership fell again after service improvements that included expanded weekend service to go along with additional evening service hours.
In the AAATA’s latest performance report to the Ann Arbor City Council, documents show that while service hours rose 21.8 percent from 95,004 to 115,724 and service miles rose 25 percent from 1,254,406 to 1,571,969, the average number of weekday passengers per service hour fell 13 percent from 28 to 24.3 passengers.These data provided to City Council a year-to-date and year-over-year snapshot of AAATA ridership and expenses.
Overall, the average number of weekday passengers rose 5 percent during the same year-over-year period outlined in AAATA’s report. AAATA’s operating expenses related to the increase in service miles and service hours rose 5.2 percent to $11,529,507 from $10,958,581. Operating expenses per service hour and per service mile are both down.
Now, three years into the five-year transit tax, AAATA is proposing service cuts and adjustments on a dozen routes. “Very low ridership” is being blamed for many of the cuts.
The Ann Arbor Area Transportation Authority officials have said that the “adjustments are a result of a scheduled review and evaluation of services, including those implemented during the first phase of the Five-Year Transportation Improvement Plan.”
Service cuts are proposed on the following routes: 5, 21, 24, 25, 32, 46 and 64.
According to the data provided to City Council, AAATA’s so-called “urban demand” ridership has risen 1 percent year-over-year, while urban demand route operating expenses have risen 19 percent to $2,683,483 from $2,246,815. Urban demand routes saw operating expenses per passenger and per service mile rise 18 and 19 percent, respectively. While urban fixed-route passengers are paying a larger percentage of the costs of their rides (17.6 percent up from 15.5 percent), on urban demand routes, the cost of the rides paid by those passengers decreased by 15 percent.
While ExpressRide passengers are paying a higher percentage of the cost of their rides, 44.8 percent, use of that service is down. The average number of weekday passengers (110) fell 10 percent. The number of passengers per service hour (12.7) has fallen 10 percent, as well. ExpressRide services run non-stop from the Canton and Chelsea areas to downtown Ann Arbor and the University of Michigan Central and Medical Campuses.
In Jan. 2016, AAATA CEO Matt Carpenter told the media lower gas prices were to blame for falling ridership.
“Low fuel prices are depressing ridership in transit agencies across the nation,” he said. “This is not a local phenomenon. It’s very much an artificial situation because of the price of oil, which we know is a very political situation that’s coming out of the Middle East. So, it’s a temporary situation,” said Carpenter.
According to data compiled by the state, in May 2015 a gallon of gas in Ann Arbor cost, on average, $2.56. In May 2017, a gallon of gas, on average, cost about $2.40 per gallon. Between 2015 and 2017 gas prices in Ann Arbor rose as high as $3.04 per gallon (Sept. 2015) and as low as $1.44 per gallon (Feb. 2016).
AAATA’s operating expenses overall have risen 5.2 percent to $11,529,507 from $10,958,581. A March 24, 2017 memo to City Council in Council’s May 15, 2017 packet states that to date AAATA’s total revenues are 2 percent under budget, and expenses are 9 percent under budget.


Thanks for keeping the AAATA accountable on this. It’s important for citizens to know what they paid for and what the outcome was.